On 13 September 2026, the satellite USA 32 broke apart in low Earth orbit. The fragmentation was confirmed at approximately 21:13 UTC, with the note that all tracked debris was being incorporated into routine conjunction assessment screenings and that no immediate threats had been identified.
Beyond that notice, little is publicly known about the event. As a classified object, the satellite has no published orbit information and no available design data, the cause of the breakup has not been established, and the number of fragments it created is unknown and likely to remain so.
Two questions can be approached through modelling: what the largest surviving fragments might look like, and how long the resulting debris could remain in orbit.
The Object and Its Orbit
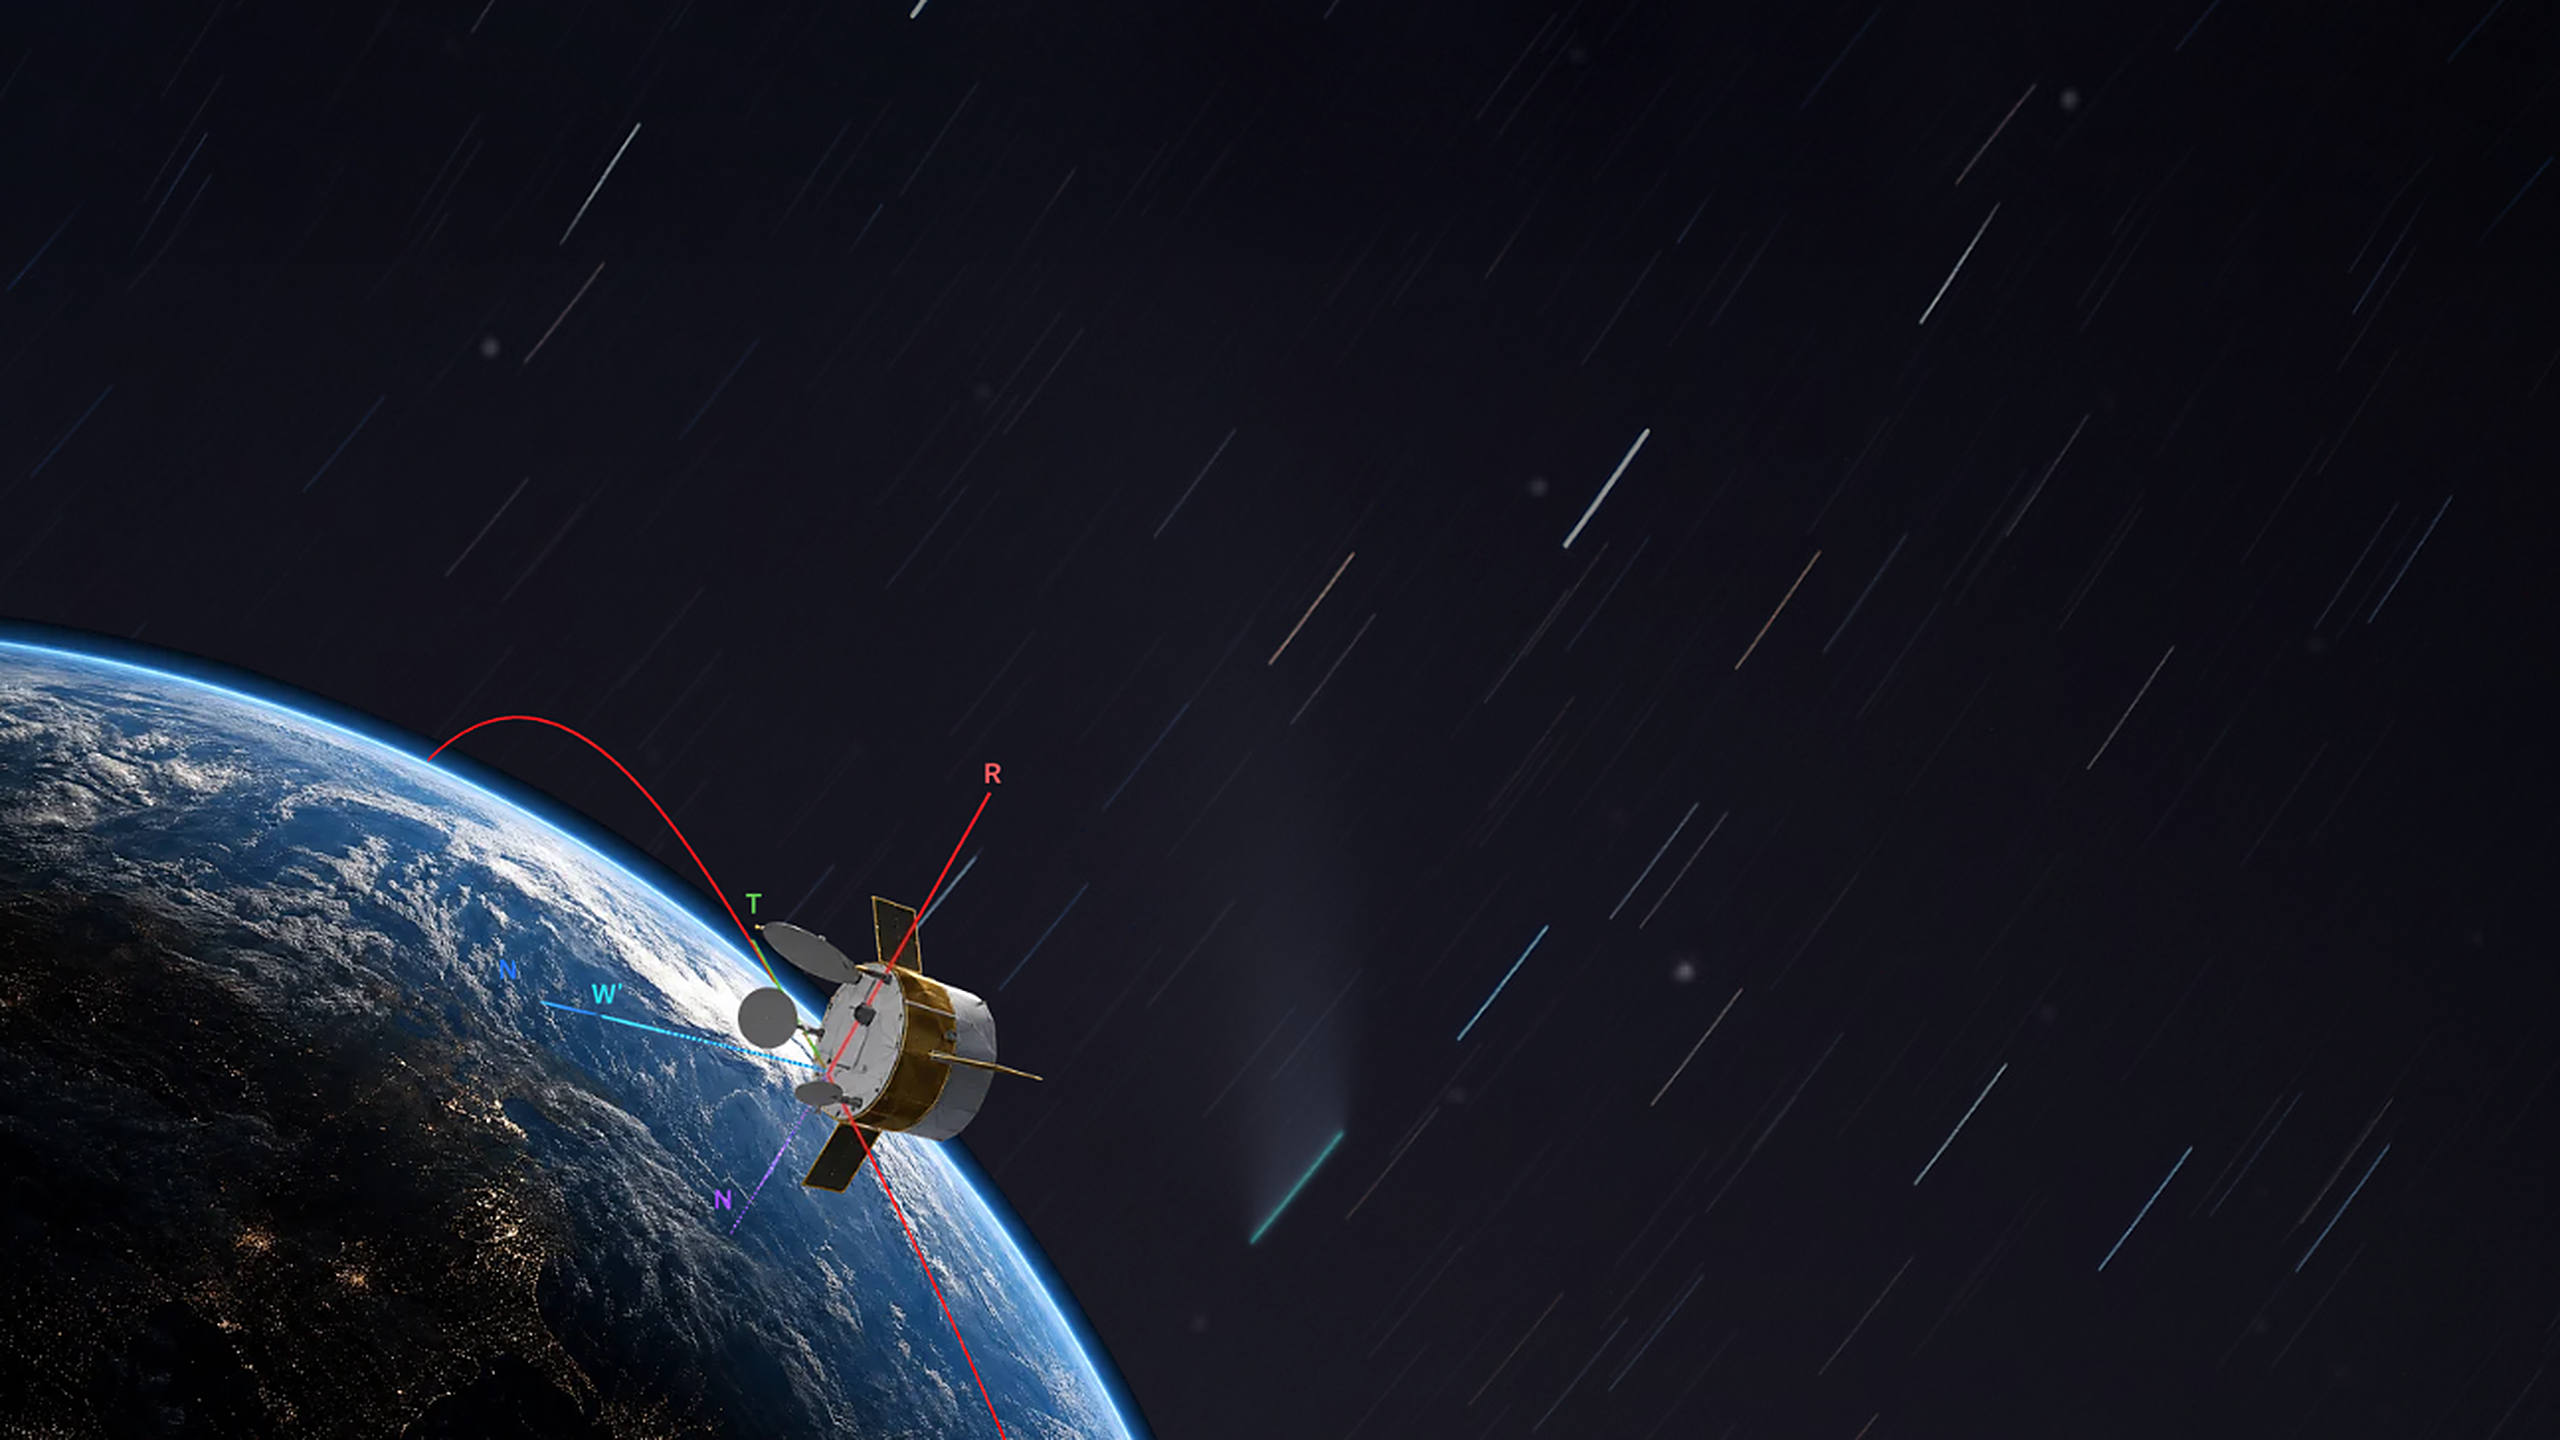
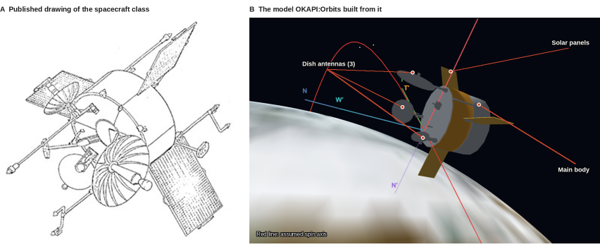
USA 32 is believed to be FARRAH III, a National Reconnaissance Office electronic intelligence satellite launched in 1988. That identification, and for the most part the background on the satellite, comes from a single report published by The Space Review in March 2025. The object likely used a spin stabilised design with three solar panels and three large antennas, and related FARRAH satellites may have remained active for decades, with indications of continued rotation as late as 2021.
What Caused the Breakup?
Breakups are typically caused by a collision, an explosion, or a combination of both. The satellite orbited at about 780 kilometres in a near polar orbit, which places it within one of the most congested regions of low Earth orbit and within the region where all known on orbit collisions have occurred. Because the orbit is long lived, the event raises concerns about persistent debris.
The actual cause of the breakup remains unknown and can only be speculated upon at this stage, which is why both a collision and an explosion were carried through the analysis.
Why the Largest Fragments Are the Hardest to Predict
The NASA Standard Breakup Model provides statistical estimates of fragment populations based on spacecraft properties, and a new MASTER breakup model extends that approach by also predicting fragment materials and shapes. Both are derived from test data and validated with observed breakups, and both reach their limit at the top of the size range, where predictions for the largest fragments remain highly uncertain. Those largest remnants are what the first of the two questions asks about.
To understand them better, OKAPI:Orbits developed a simple physics based model built on engineering assumptions about the structure of the satellite. It is discretised into voxels, and the model simulates energy transfer through materials and through the structural joints that hold subsystems together, which provides more realistic insight into which parts might survive an event.
Building the Model
The model includes sub-systems and is complete with material mass shares and bond strengths, none of which exists publicly for this object, which means all of it had to be constructed from engineering judgment and from other designs of spin stabilised satellites of the same era. It also includes a thermal radiator skirt extending down over the thruster that could be retracted for thermal regulation, a feature that is guess work, founded in other designs of the same class.
These assumptions set the limit on what the results can show. The model has been checked with other known breakup events as well as with ground based impact tests and remains under validation, with early results that are promising enough to treat the approach as a complement to the established breakup models.
Simulating Collision and Explosion
Two Monte Carlo analyses were performed:
– An impact of a 100 gram object at 11 kilometres per second, between impact angles of plus and minus 90 degrees within the horizon plane onto the main body.
– An explosion of the battery at energy levels between 10 and 60 joules per gram, covering non catastrophic as well as catastrophic energy levels.
Several distinct fragmentation modes emerged across the 40 runs. In most of them the three radio dishes separated and remained largely intact, which makes them the largest surviving fragments in the simulation. The satellite bus, the solar panels and some internal electronics also survived to varying degrees depending on impact energy and geometry, with the solar panels showing more damage than the dish antennas.
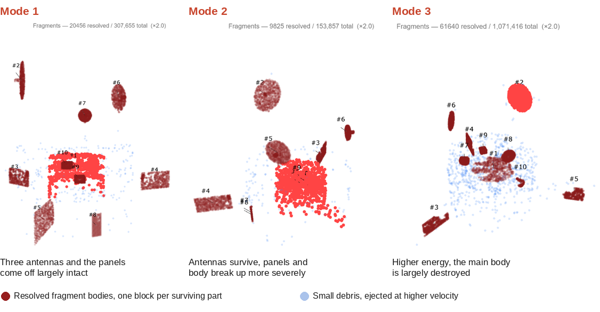
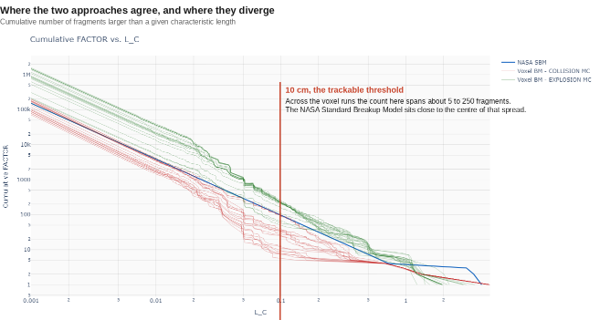
The number of fragments above 10 centimetres varied between five and about 250 across the runs, a spread that reflects how strongly the outcome depends on where and how the energy is delivered, and one that matches other known on orbit breakups well. The NASA Standard Breakup Model lies close to the centre of that range and therefore remains a reasonable average estimate of the fragmentation outcome, although it cannot indicate where within the range a specific event falls or which structures account for the largest objects in it.
Holding the Simulation Against Optical Observations
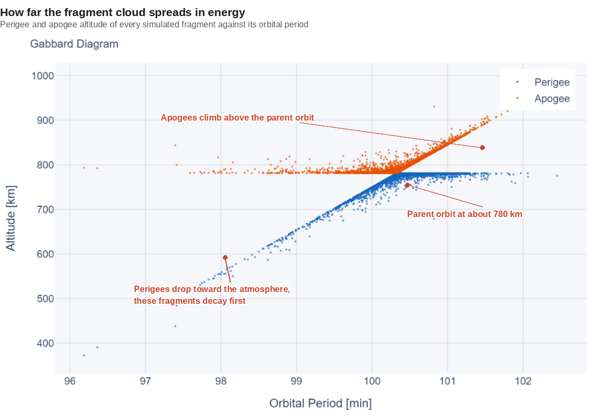
Optical observations of the event have been reported publicly. They describe one large remnant object, three objects close to it with consistent brightness, two additional fragments further off with fluctuating brightness, and further fragments that had already dispersed.
Observation and simulation approach the same event from different directions, which makes it worth holding one against the other. Five objects in the vicinity of a large remnant is close to what the simulations produced whenever the three dishes and the solar panels separated as units, although whether those five are in fact antennae and solar panels cannot be concluded from this without sincere scepticism, given the number of unknowns and assumptions behind the model, the single event it covers, and the three solar panels that are assumed against only two fluctuating objects reported.
Long term orbit developments may shed light on the area to mass ratio of the objects, since a dish antenna and a damaged solar panel do not decay at the same rate. The identification is therefore testable, and it will be settled by the orbit data over the coming months.
How Long the Debris Remains in Orbit
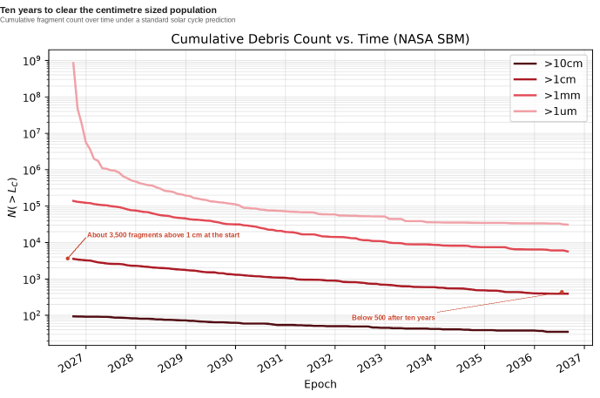
The long term impact on the space environment was assessed by propagating the simulated debris cloud over time, using the NASA Standard Breakup Model with 100 trackable objects as a guiderail, a figure that fits the voxel based results as well as the reports of additional smaller debris that dispersed more quickly.
On that basis the event created roughly 3,500 fragments larger than 1 centimetre. Assuming a nominal solar cycle, that population declines steadily through orbital decay and reaches just below 500 after about ten years, which is the gradual cleansing effect of atmospheric drag. Even so, a significant debris population may persist for decades, continuing to contribute to the congestion of low Earth orbit.
It is worth separating the two size classes here. Conjunction screening covers the trackable population, which starts at about 10 centimetres, and those objects can be avoided. The centimetre sized fragments are not covered by that screening, and an impact from one of them can still end a mission.
Conclusion and Outlook
Breakup events remain only partially understood, and this one shows what that means in practice for an analysis. Because the object is classified, every material property entering the model is an assumption; because the cause is unknown, both a collision and an explosion had to be carried through; and because the fragment count will most likely never be published, the results can only be compared with optical observations.
Within those limits both questions have answers. The largest surviving fragments are most likely the three dish antennas, which came off largely intact in the majority of runs, alongside a large remnant of the satellite bus and the solar panels in more varying condition.
On the second question, the centimetre sized debris population falls from roughly 3,500 objects to just below 500 over about ten years as atmospheric drag gradually removes it. Smaller fragments clear considerably faster, while a significant population remains in orbit for decades and continues to contribute to the congestion of low Earth orbit. A fragmentation in this orbital regime is therefore not an event that resolves itself within a few seasons.
OKAPI:Orbits has worked with ESA on MASTER and DRAMA for years, the reference tools the industry uses to describe the debris environment. That collaboration also shows where the models stop, and the voxel based approach was built for that part. By representing subsystems and the joints between them, it resolves whether a structure leaves the satellite as one body or breaks apart, and it keeps every assumption behind that answer visible.
That matters once someone has to act on it. Planning a mission through a regime like this one means knowing what will still be there in five years, and defending that plan to regulators, insurers or an internal review means showing how the figure was reached. OKAPI:Orbits works on both sides of that, on the models that describe the debris environment and on the orbit determination, conjunction screening and collision avoidance that operators, agencies and insurers rely on day to day.
The question this analysis cannot close is whether the five objects observed near the parent body are in fact the three dish antennas and the solar panels that the simulation produced. It does not need another simulation to be answered, because the objects themselves are already answering it. A dish antenna and a damaged solar panel carry different area to mass ratios and therefore lose altitude at measurably different rates, which means their orbits will separate in a specific pattern over the coming months and will either match the prediction or rule it out.
The answer matters beyond this single event. What survives a breakup determines what a debris environment model has to carry for the following decade, and that model is what describes the environment satellites in this shell are operated in. A population that declines from roughly 3,500 objects larger than 1 centimetre to just below 500 over ten years, with a significant remainder persisting far longer, is part of that environment for every mission flown through this regime.
If you work on debris environment modelling, on fragmentation observation, or on operating satellites in regions like this one, we would be glad to hear how you read this event at info@okapiorbits.com.
Sources:
U.S. Space Forces-Space fragmentation notice for USA 32 (#19460), 13 September 2026. Source of the event time, the catalogue number and the screening statement.
“Stars in the sky: The top secret URSALA, RAQUEL, and FARRAH satellites from the 1970s to the 21st century”, The Space Review, March 2025. Source of the FARRAH III identification, the spin stabilised design and the reported rotation in 2021. https://www.thespacereview.com/article/4951/1
Drawing of the satellite class: NRO/NSA, via Gunter Krebs. Directory of U.S. Military Rockets and Missiles, Appendix 3. https://designation-systems.net/dusrm/app3/index.html
Observation report by s2a and Neuraspace. Source of the brightness behaviour of the objects near the parent body. https://lnkd.in/p/dYyY6G2W
.jpg)

